Momentum subscribers click here to read the full report
Modernization is the pervasive outsourcing driver for 2018 and going into 2019, and for most enterprises, modernization means more cloud. Modernization was the clearest and strongest theme found in analyzing outsourcing activity in dozens of countries as we prepared the 2018 ISG Momentum® Geography Report, and cloud-based services are the most commonly pursued means for attaining modernization. Outsourcing penetration reached an all-time high during the year.
Digital transformation is also a major and pervasive outsourcing driver. It involves modernization of both IT systems and business processes, and often entire business models. While cloud services for infrastructure, application delivery and business services are common in digital transformation programs, enterprises are looking at a broader set of technologies and services to help them change. Enterprises frequently seek help from service providers to understand whether artificial intelligence, robotic process automation (RPA), Internet of Things (IoT) technologies, blockchain, IT automation, DevOps and new ways of applying analytics can help their organizations. There are many pilot programs occurring for these and other technologies. These pilots do not always make a major impact on market spending data, but many will eventually have a strong influence on how business gets done and how services are delivered.
Highlights
In 2018, outsourcing activity has been consistently solid in all major regions. ACV declines flattened in 2018 and, through the first three quarters, every region was within at least 85 percent of its 2017 total. The chart below shows regional ACV changes over the last decade and also offers perspective on the relative market size for each region. For example, outsourcing ACV in Europe in 2017 was $41.6 billion, more than the total of the other two largest regions, North America ($24.4 billion) and Asia Pacific ($14.1 billion).
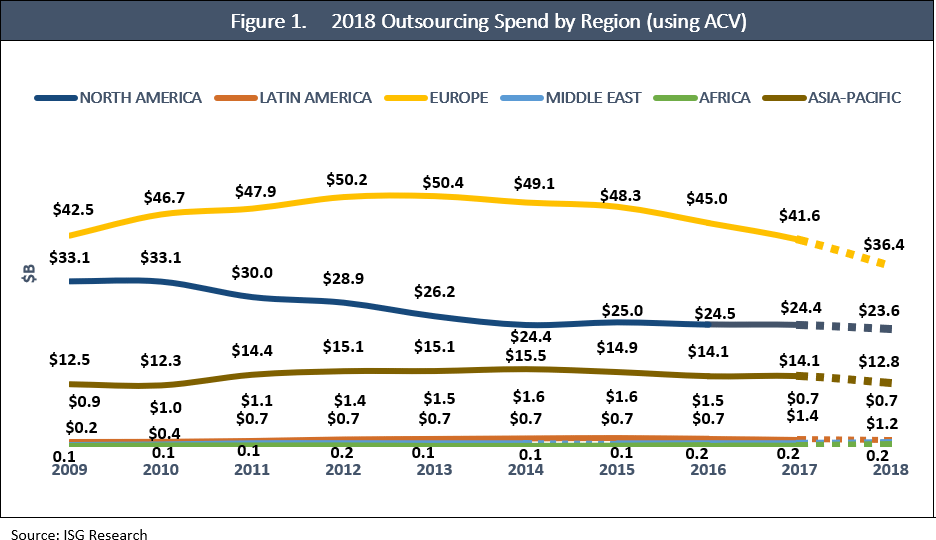
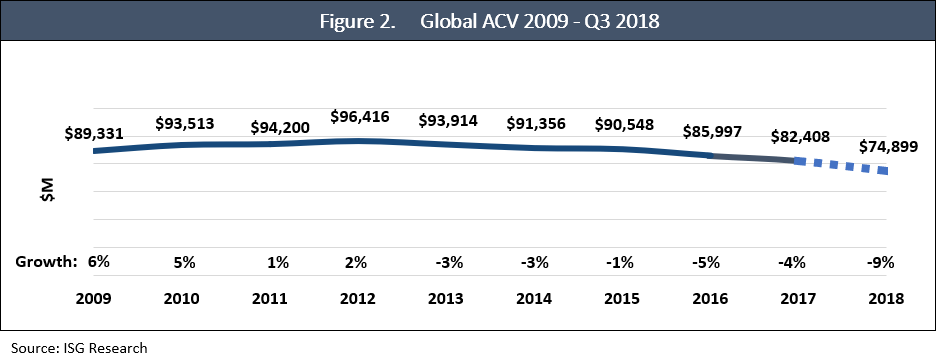
Figure 2 shows the year-over-year global ACV total since 2009. ACV fell 4 percent in 2017 and 5 percent in 2016. Before that, the annual ACV total had not changed by more than 3 percent for five consecutive years. Through the first three quarters of 2018, the ACV total was within 9 percent of the entire previous-year total, so a strong fourth quarter could push the global market to growth. That is also true in many individual countries.
In 2018, the outsourcing penetration rate among Forbes® Global 2000 companies reached 55 percent, which is the highest level ISG has recorded. The 6 percent penetration rate increase from 2017 is also especially high; global penetration typically doesn’t change by more than 2 percent year-over-year. The rapidly increasing availability and adoption of cloud services is likely the leading factor behind the outsourcing adoption growth. Online storage, SaaS, virtual desktops and other cloud-based desktops have made it much easier for companies to outsource some of their IT functions and business processes, especially for smaller companies, where outsourcing penetration has historically lagged. In 2018, there was year-over-year outsourcing penetration growth in every company-size quartile except the 1-50 category of the G2000.
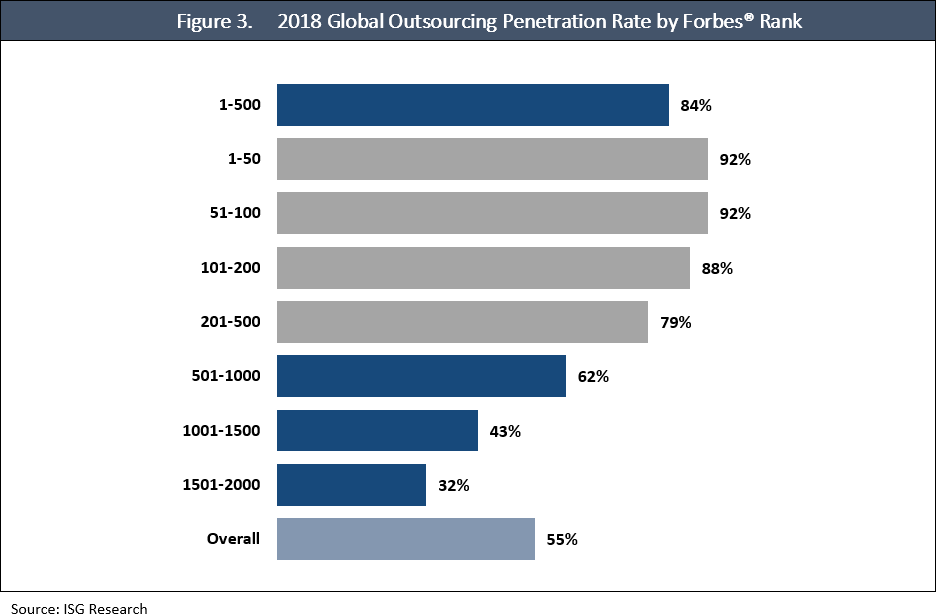
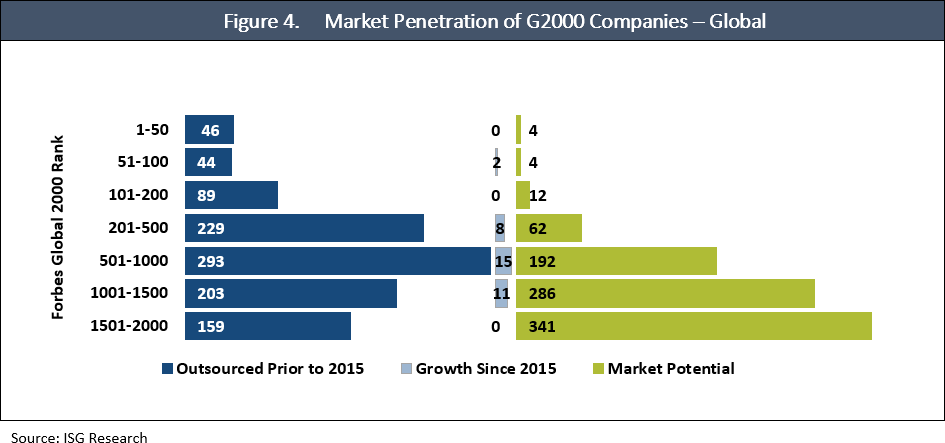
Figure 4 shows the net change in outsourcing penetration by G2000 company-size segment since 2015, plus the total number of sourcing and nonsourcing companies in each segment. Since 2015, 72 percent of the outsourcing adoption growth has been among companies ranked between 501 and 1,500 of the G2000, which indicates a rise in midmarket sourcing adoption.
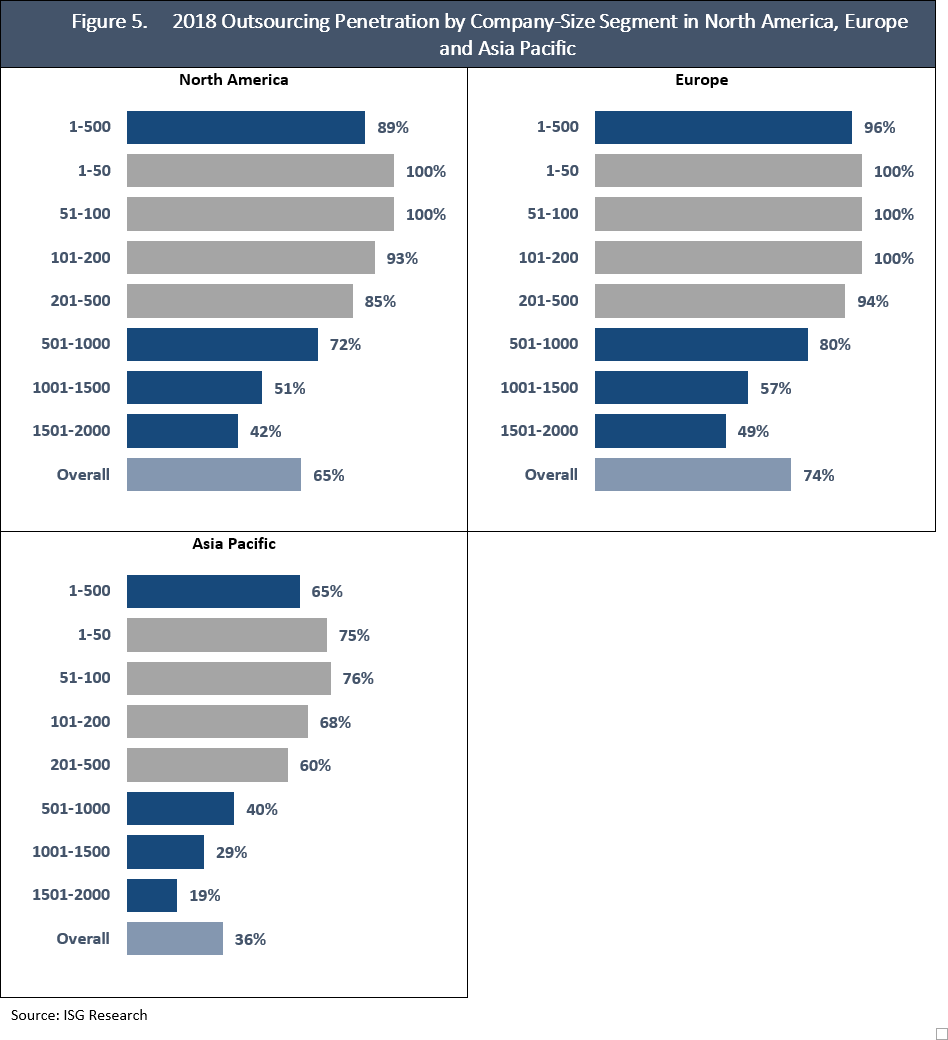
Europe is not only the highest-spending regional outsourcing market, it has by far the most outsourcing penetration (Figure 5). Nearly three-quarters of all European G2000 companies had active outsourcing contracts in 2018, including 49 percent of midsize companies that rank 1,501 – 2,000 in the G2000. Outsourcing penetration among midsize European companies is greater than the level for all Asian G2000 companies (36 percent). The Asia Pacific region continues to offer tremendous new business potential.
The average annual ACV among all current outsourcing clients in the G2000 is $68.2 million, but that varies considerably by company size (see Figure 6). The average spending disparity is a reason why the number of large companies in a country is a key indicator of the country’s market potential. As outsourcing engagements have been trending toward cloud-based agreements that are more limited in scope and duration, average and overall spending levels have been declining.
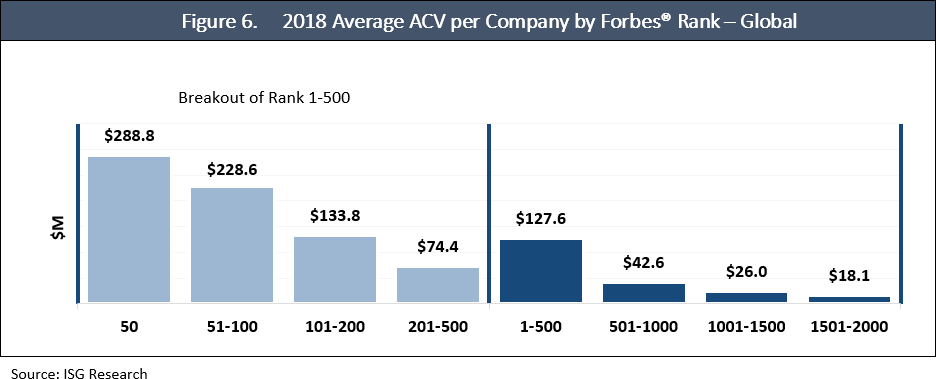
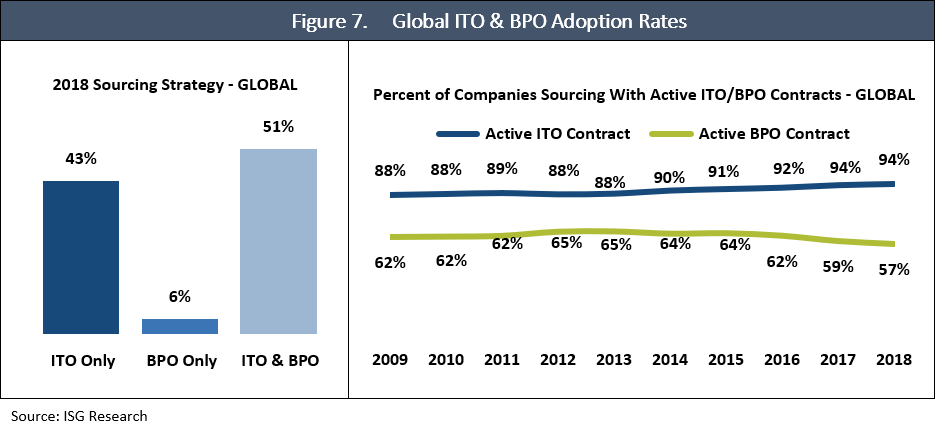
Figure 7 shows the percentage of all G2000 outsourcing clients (not all 2,000 companies) that currently have active ITO or BPO contracts, and it breaks out the percentage of clients that have one, the other or both. The decline in BPO penetration does not necessarily indicate that fewer companies are outsourcing business process services. The penetration percentage can decline even if there is net growth in the number of companies outsourcing, which would occur if ITO adoption rose faster than BPO adoption. For example, if a company that begins outsourcing only by contracting for cloud hosting services, the overall outsourcing penetration rate would increase, but the percentage of outsourcing clients that use BPO services would decrease.
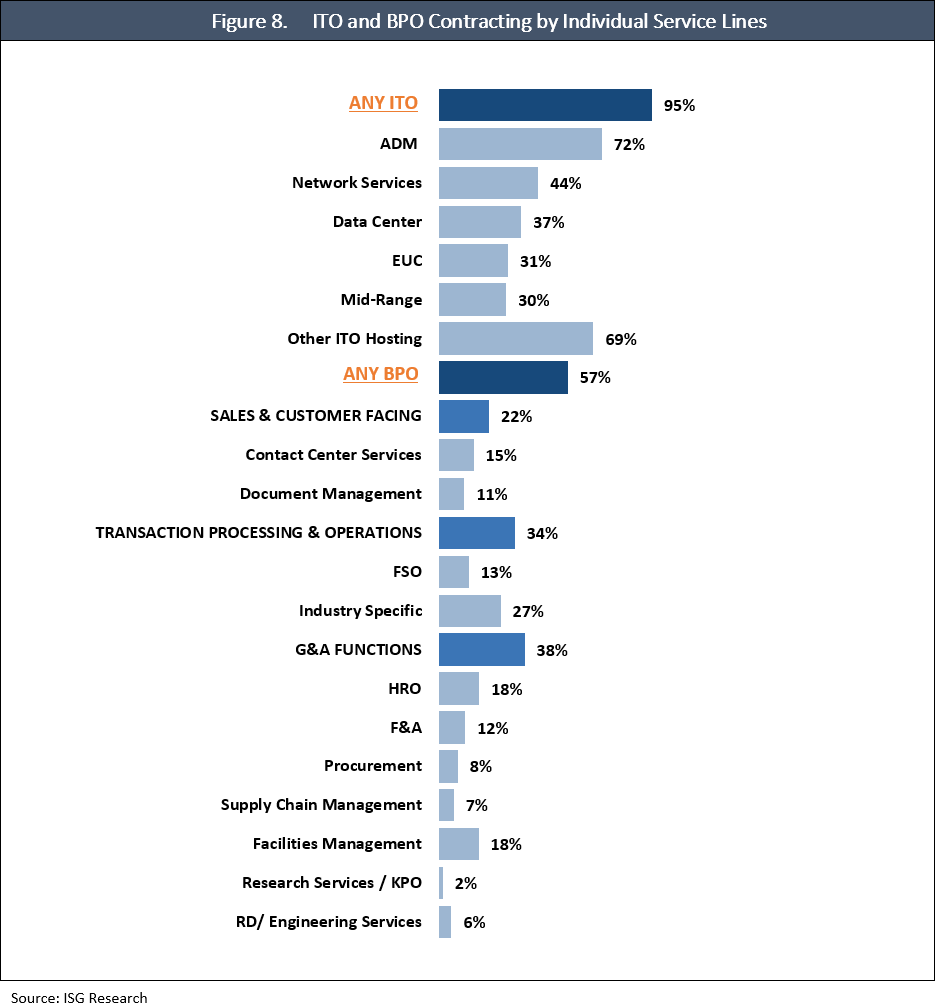
Nevertheless, client penetration is not deep for most BPO service lines (Figure 8). Other than industry-specific services, no BPO service-line category has been adopted by more than 18 percent of G2000 clients. The ITO market also has tremendous new business opportunity, despite the prevalent use of ADM and hosting services.
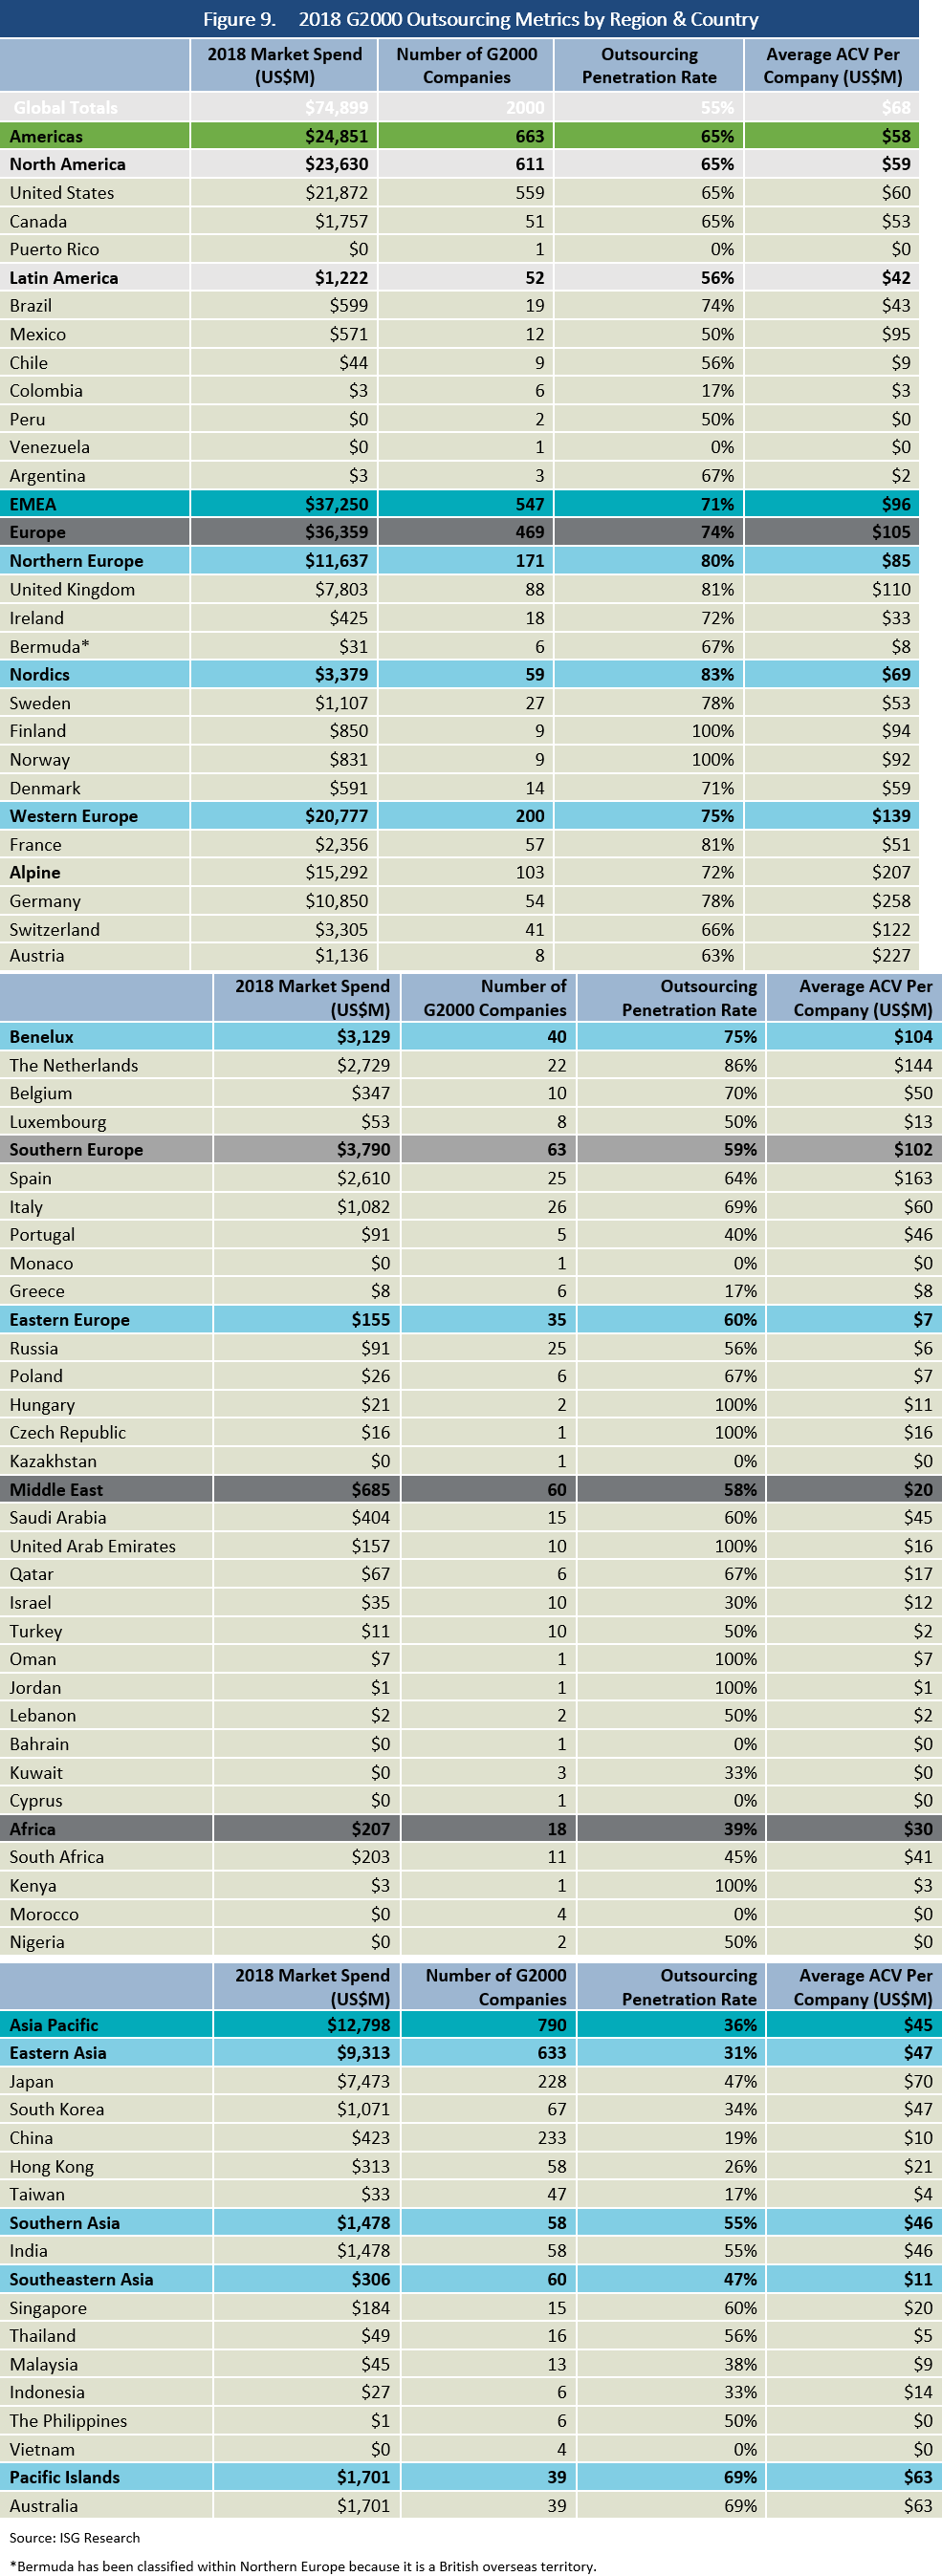
The table on the next pages (Figure 9) provides a snapshot view of market status and opportunity. It lists the 2018 ACV level in the first three quarters by region and for major countries (some small-market countries are excluded from the listing to save space but are counted in the regional totals). It also includes their number of G2000 companies, the outsourcing penetration rate among those companies and their average annual spending level.
In the first three quarters of 2018, there were 15 countries that had at least $1 billion worth of ACV for active outsourcing contracts. Nine of the 15 top countries are in Europe, which also accounts for six of the top eight. Country-level penetration rates can be a misleading indicator of market strength because the rates can be easily skewed in countries without many G2000 companies. Similarly, the average per-company ACV provides some context about outsourcing habits and maturity, but average spending is more influenced by a company’s size than by its geography.
Momentum subscribers click here to read the full report
About the author
Paul Reynolds
Paul Reynolds leads Momentum, a division of ISG that provides research services to help service providers better target, win and retain business. Paul has 25 years of market research experience with specific expertise in methodology development, data analytics and research process design. Having found many service providers’ Advisor Relations functions to lack appropriate analytics, Paul is working to develop innovative new approaches that allow for data-driven programs based on the unique needs of each client. His approach benefits Advisor Relations, go-to-market functions, sales, strategy, marketing, and market/competitive intelligence teams.
